20 Customer Service KPIs that CS Leaders Must Track in 2026
Customer service KPIs are meant to tell CS leaders whether their team is improving or declining over time. That was straightforward when every ticket was handled by a human. It's far less obvious now that AI resolves a growing share of customer conversations, since most KPIs still combine AI- and human-resolved results into a single number.
This guide covers the customer service KPIs to track in 2026, what each measures, and which ones actually deserve a place on your dashboard.
What Is a Customer Service KPI?
A metric is any number you can measure. A KPI is a metric tied to a goal you're actually accountable for this quarter. Ticket volume on its own is a metric. Ticket volume tracked against agent headcount, because you're deciding whether to hire, is a KPI. Most lists of customer support KPIs skip this distinction entirely and just hand you every number a helpdesk can export.
The distinction matters more than it sounds. Teams that treat every available number as a KPI end up with a 20-tile dashboard nobody acts on. For a broader list of customer experience customer service metrics worth having on hand, even when they're not tied to a specific goal, that's a separate list from the KPIs below.
20 Customer Service KPIs to Track
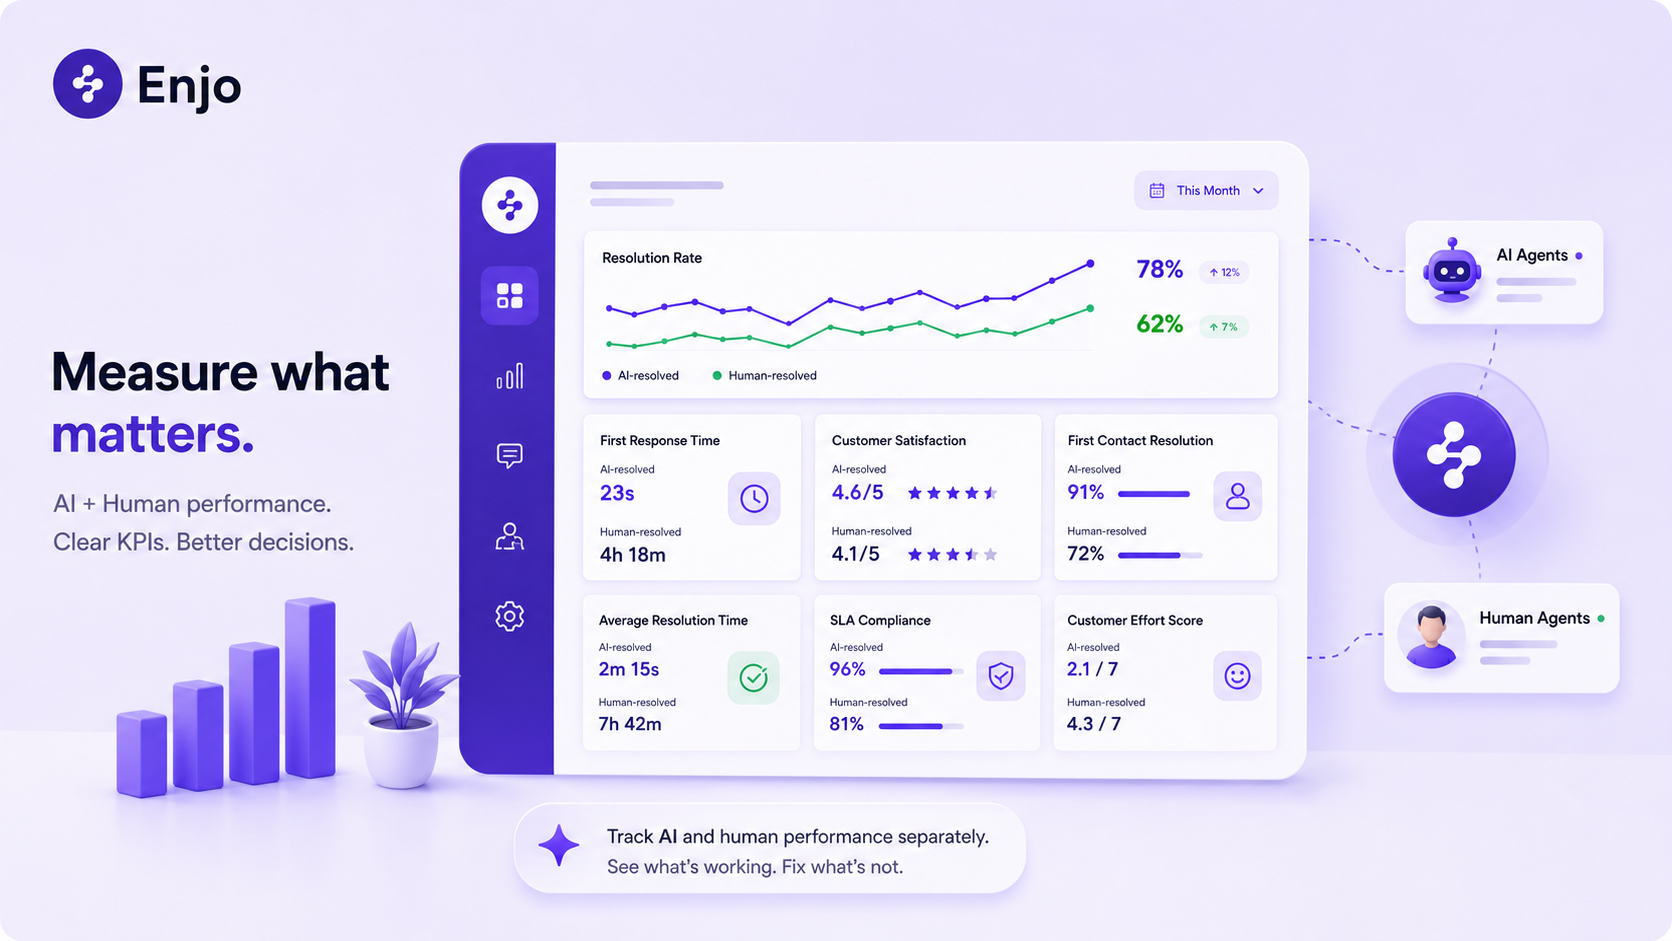
Some of the KPIs below should be reported twice, once for AI-resolved conversations and once for human-resolved ones, since a single blended average can make very different operational situations look identical. Others are relationship- or team-level by nature, and forcing the same split just adds noise rather than signal. Each definition below explains which applies.
Self-service resolution rate, sometimes called deflection rate, is worth naming here too, even though it's not one of the twenty KPIs below: it measures the volume that never became a ticket at all, since it's resolved through self-service or an AI agent before a ticket is ever created, and on a team running AI resolution alongside a real help center, it's often larger than every ticket-based KPI combined.
First Response Time (FRT)
First response time is the time from ticket creation to the first reply. AI-resolved FRT reflects system latency and sits close to instant; human-resolved FRT reflects real staffing and triage. Blending the two makes a well-staffed, AI-heavy team look identical to an understaffed team that got lucky on volume mix.
Average Resolution Time (ART)
Average resolution time is the total resolution time divided by the number of tickets resolved, capturing the full lifecycle rather than just the first touch. AI-resolved ART typically lands in seconds or minutes; human-resolved ART reflects real complexity and backlog. A rising blended average could mean cases are genuinely harder, or that AI resolved the easy ones and passed a tougher mix to your team.
Average Handle Time (AHT)
Average handle time is the active work time an agent spends per ticket, not counting time spent waiting. It's a capacity metric, not a satisfaction metric, and it doesn't mean much when measured on the AI side, since AI doesn't work the way a human agent does. Track it specifically for your human team to size headcount, rather than to compare against AI.
Customer Satisfaction (CSAT)
CSAT is the percentage of customers who rate an interaction positively on a post-resolution survey, usually on a 1-5 scale or a thumbs up/down. It's the most commonly tracked customer service KPI, and also the one most damaged by blending. A drop in blended CSAT could mean AI is giving confidently wrong answers, or it could mean your human team is overloaded, and rushing replies, and those are opposite root causes with opposite fixes.
First Contact Resolution (FCR)
FCR is the percentage of tickets resolved in a single interaction, with no follow-up required, calculated as the number of tickets resolved on first contact divided by the total number of tickets. An 85% blended FCR could hide a 95-to-55 AI-to-human split or a 90-to-80 split, and those describe very different support operations. Split FCR by resolver before drawing any conclusion from the number.
Customer Effort Score (CES)
CES asks customers to rate how easy an interaction felt, usually on a 1-7 or 1-10 scale, on the theory that low effort predicts loyalty better than satisfaction alone. AI-resolved CES reflects how easy the self-serve or bot interaction felt; human-resolved CES reflects agent-side friction like transfers and repeated questions. A blended CES tells you effort is a problem somewhere, not where.
Resolution SLA / SLA Compliance
SLA compliance is the percentage of tickets resolved within a committed time window, usually tiered by priority. AI resolution is close to instant by default, so AI-heavy teams often see blended SLA compliance climb even when the human side of the operation hasn't improved at all. Track SLA compliance for human-resolved tickets, specifically if the commitment is meant to reflect your team's actual responsiveness.
Quality Score (QA Audit)
Quality score comes from an internal audit: a sample of closed tickets scored against a rubric for tone, accuracy, and policy adherence. AI-resolved conversations can be scored on 100% of the volume, since the audit can run automatically, whereas human QA usually remains sample-based. Comparing a 100%-audited AI score against a 5%-sampled human score as if they're the same kind of number is a common reporting mistake.
Cost per Resolution
Cost per resolution is the total support cost divided by the number of tickets resolved over a period, intended to indicate whether support is becoming more or less expensive to run. AI-resolved and human-resolved costs can differ by 10 to 50 times, depending on complexity and the AI pricing model. A blended cost per resolution trending down could mean genuine efficiency gains, or it could mean volume mix shifted toward AI without either resolution type actually getting cheaper.
AI Autonomous Resolution Rate
The AI autonomous resolution rate is the percentage of AI-touched conversations resolved without ever escalating to a human. It's the headline number most CS leaders report to leadership when asked how automation is progressing. It has no pre-AI equivalent, because there was no AI-touched category of ticket to measure before AI resolution existed as a workflow.
Escalation Rate
Escalation rate is the inverse of autonomous resolution rate: the percentage of AI-touched conversations handed to a human. Where the resolution rate is the number leadership wants, the escalation rate is the number your automation team actually works from, since it points directly at what AI isn't confident enough to handle. A rising rate of escalation on stable ticket types usually signals a knowledge gap, not a model problem.
AI autonomous resolution rate and escalation rate are two sides of the same signal, and they're worth naming separately because different audiences ask for different framing. Leadership wants to hear "AI resolves 62% of volume." Your team planning the next automation build wants "38% still escalates, and here's why." Neither existed as a customer support KPI before AI resolution, because there was no AI-touched category to measure against.
Retention, churn, and a handful of other business-level KPIs don't split cleanly by AI versus human. They're still worth tracking, just not with the same lens.
Net Promoter Score (NPS)
NPS asks customers how likely they are to recommend the company, on a 0-10 scale, then nets the percentage of detractors (0-6) from promoters (9-10). It's a relationship-level metric, not tied to any single resolution, so it doesn't split meaningfully by AI versus human the way FCR or CSAT does. Track it as a lagging indicator of overall support quality, not a per-interaction score.
Customer Retention Rate
Customer retention rate is the percentage of customers still active at the end of a period compared to the start, excluding new customers acquired during that period. It's downstream of many touches over time, support included, so one bad AI interaction rarely shows up here directly. Still worth watching alongside support KPIs to catch whether support quality is contributing to churn.
Customer Churn Rate
Churn rate is the inverse of retention: the percentage of customers lost over a period. Same underlying signal, same caveats. Support teams rarely move this number on their own, but a spike is worth investigating alongside a drop in CSAT or FCR.
Customer Lifetime Value (CLV)
CLV estimates the total revenue expected from a customer over the life of the relationship, typically calculated using average purchase value, purchase frequency, and average customer lifespan. It's a business-level KPI that indirectly supports and influences retention and expansion. It shouldn't be something a support team is measured against directly.
Agent Satisfaction (eNPS)
Agent satisfaction, often measured as an employee's Net Promoter Score, asks your support team how likely they are to recommend working at your company. It's a purely human-team metric with no AI-side equivalent to split against. Worth tracking, especially as AI takes on more routine volume, since the agent role and workload shift in ways that directly affect this number.
Ticket Volume
Ticket volume is the total number of requests logged in a period, the most basic customer support KPI there is. It only counts what became a ticket, so it undercounts real demand once AI resolves requests before anything is ever logged. Still useful for capacity planning, paired with the self-service resolution rate to see the full picture.
Ticket Backlog
Ticket backlog is the number of open, unresolved tickets at a given point in time. It's a staffing and capacity signal rather than a resolution-quality one: a growing backlog usually means demand outpaced capacity, not that quality dropped. Watch it alongside AHT and FRT to catch capacity problems before they surface in customer-facing numbers.
Ticket Reopens
Ticket reopens track the percentage of resolved tickets a customer reopens, usually because the original resolution didn't hold. It's a strong proxy for resolution quality that FCR alone can miss, since a ticket can close on first contact and still be wrong. Worth tracking by channel, though you'll need a fairly large sample size before meaningfully splitting it between AI and human.
Volume by Channel
Volume by channel shows how requests are distributed across Slack, email, chat, and any other channels you support. It's more of a routing and capacity-planning input than a performance KPI on its own. Useful for deciding where to invest in AI coverage next: a channel carrying disproportionate volume with low AI involvement is usually the next automation target.
Tracking Customer Service KPIs Across Multiple Tools
The AI-versus-human split above assumes you can see both numbers in one place. On most B2B support stacks, you can't. If AI resolves requests in Slack, tickets escalate to Zendesk or Jira, and self-service happens in a separate help center tool, "resolution rate" means three different partial numbers depending on which system generated the report.
This isn't a hypothetical. It's the default state for a team running Salesforce or Zendesk with a bolted-on AI layer that only reads its own conversation logs, plus a separate knowledge base tool with its own analytics. Reconciling those three numbers into a single true figure is usually a manual export-and-join exercise, repeated every reporting cycle.
How Enjo Helps You Improve These Tracks Customer Service KPIs
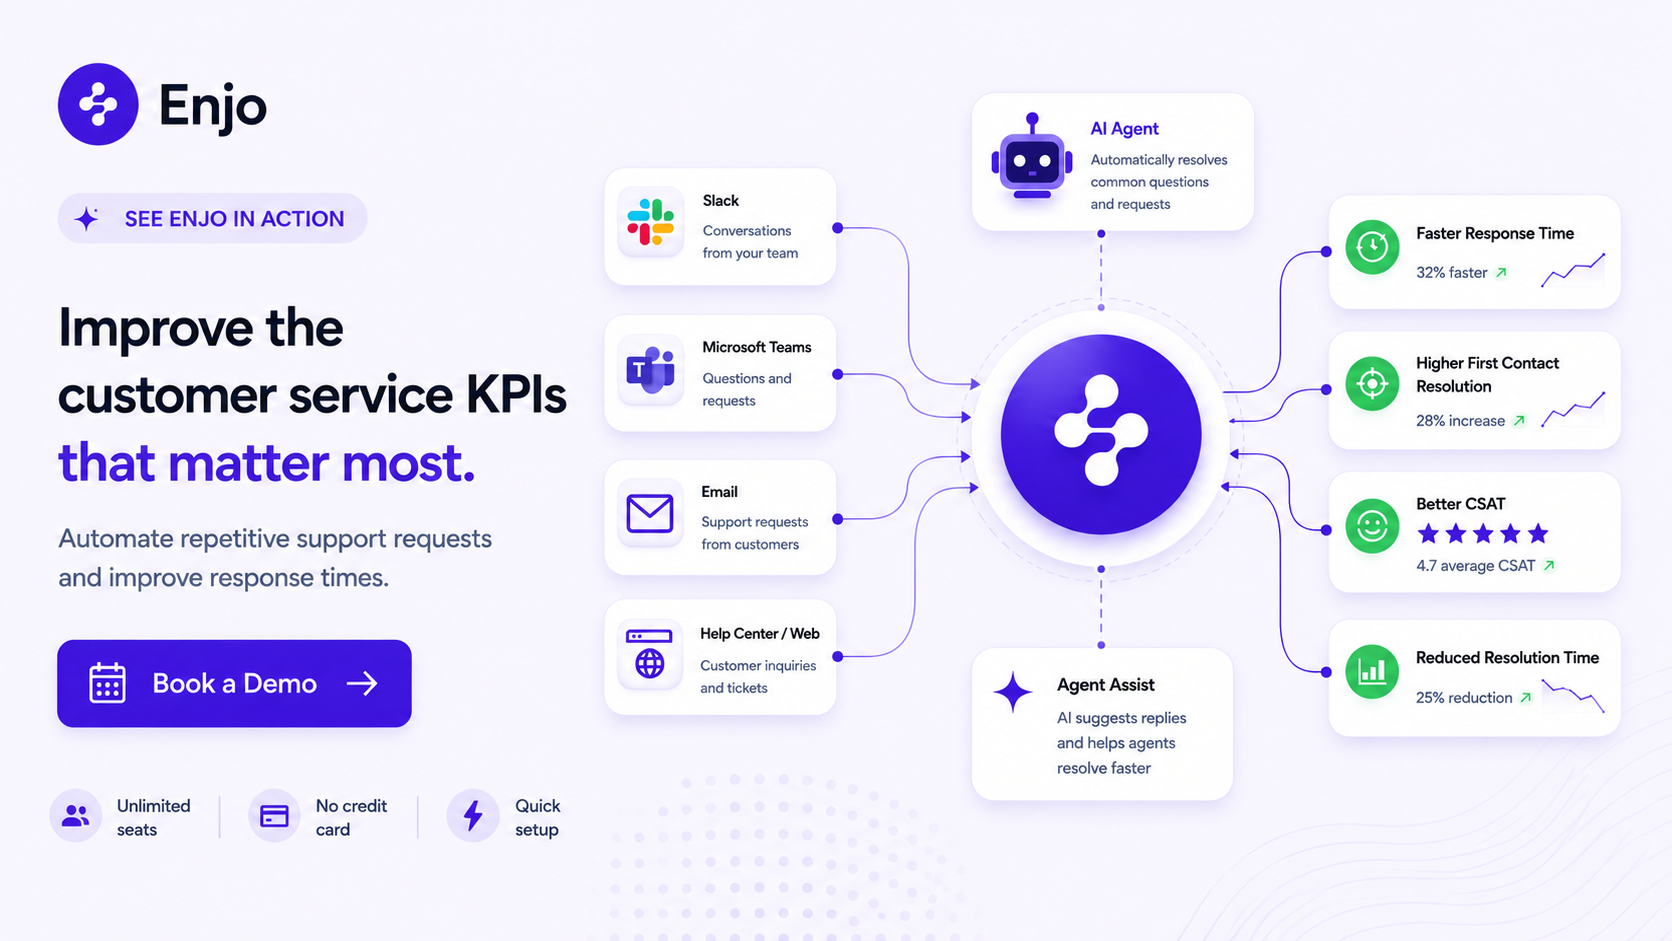
Enjo doesn't just help you track these numbers; it changes them by automating the work behind them. AI Agents resolve routine requests in Slack, Teams, or a help center before a ticket ever needs a human, which drives first-contact resolution and self-service resolution rates. Agent Assist gives human agents real-time case summaries and reply suggestions, which help reduce average handle and resolution times for tickets that reach a person.
Sentiment analysis flags negative or escalated conversations early, protecting CSAT and CES before a bad interaction turns into a bad review. Insights surfaces the trends across ticket volume and sentiment, giving a CS leader a way to measure the impact of support automation instead of pulling a manual report every quarter.
Aptean is a useful illustration of scale. Across 80+ products and 3,500+ employees, Aptean uses Enjo AI Agents to accelerate 200,000+ customer service requests a year, work equivalent to roughly 120 additional agents, with 2M+ documents indexed as the knowledge base behind it. That's automation moving the underlying numbers, not a dashboard reporting on them after the fact.
How Many Customer Service KPIs to Track
Not every KPI above deserves a permanent home on your dashboard. Pick the ones tied to a decision you're actually making this quarter: hiring, automation investment, or an SLA renegotiation. Cap it at five or six. If a KPI hasn't changed a decision in two review cycles, retire it rather than let the dashboard grow past what anyone actually reads.
Customer Service KPIs: A Quick Recap
Track KPIs as two numbers, not one, whenever AI and a human might both touch the same type of request: split FCR, CSAT, resolution time, and cost per resolution by who actually resolved it. Keep NPS, retention, churn, and a handful of others as single numbers, since they don't split meaningfully by resolver. Doing this on a fragmented stack usually means reconciling exports by hand every reporting cycle. Either way, cap the dashboard at five or six KPIs tied to a real decision, not everything a helpdesk can export.
Frequently Asked Questions
What's the difference between a customer service KPI and a metric?
A metric is anything you can measure. A KPI is a metric tied to a specific goal you're accountable for, like reducing average resolution time by a set amount this quarter. Not every metric needs to be a KPI.
How many customer service KPIs should a team track?
Five to six on a standing dashboard is a reasonable ceiling for most B2B support teams. More than that dilutes focus without adding decision-making value.
Should first-contact resolution be reported as a single number, or split by AI vs. human?
Split it. A single blended FCR can look identical whether AI is doing most of the work or almost none, and those are different operational situations that require different fixes.
What's a KPI that didn't exist before AI resolution?
Escalation rate, the percentage of AI-touched conversations handed to a human, has no pre-AI equivalent and is one of the more useful numbers for deciding where to expand automation next.
How does AI resolution rate fit alongside traditional support KPIs?
It sits next to them, not in place of them. CSAT and resolution time still matter; AI resolution rate tells you how much of that performance is coming from AI versus your human team, which changes how you'd act on the number.
What Is a Customer Service KPI?
A metric is any number you can measure. A KPI is a metric tied to a goal you're actually accountable for this quarter. Ticket volume on its own is a metric. Ticket volume tracked against agent headcount, because you're deciding whether to hire, is a KPI. Most lists of customer support KPIs skip this distinction entirely and just hand you every number a helpdesk can export.
The distinction matters more than it sounds. Teams that treat every available number as a KPI end up with a 20-tile dashboard nobody acts on. For a broader list of customer experience customer service metrics worth having on hand, even when they're not tied to a specific goal, that's a separate list from the KPIs below.
20 Customer Service KPIs to Track
Some of the KPIs below should be reported twice, once for AI-resolved conversations and once for human-resolved ones, since a single blended average can make very different operational situations look identical. Others are relationship- or team-level by nature, and forcing the same split just adds noise rather than signal. Each definition below explains which applies.
Self-service resolution rate, sometimes called deflection rate, is worth naming here too, even though it's not one of the twenty KPIs below: it measures the volume that never became a ticket at all, since it's resolved through self-service or an AI agent before a ticket is ever created, and on a team running AI resolution alongside a real help center, it's often larger than every ticket-based KPI combined.
First Response Time (FRT)
First response time is the time from ticket creation to the first reply. AI-resolved FRT reflects system latency and sits close to instant; human-resolved FRT reflects real staffing and triage. Blending the two makes a well-staffed, AI-heavy team look identical to an understaffed team that got lucky on volume mix.
Average Resolution Time (ART)
Average resolution time is the total resolution time divided by the number of tickets resolved, capturing the full lifecycle rather than just the first touch. AI-resolved ART typically lands in seconds or minutes; human-resolved ART reflects real complexity and backlog. A rising blended average could mean cases are genuinely harder, or that AI resolved the easy ones and passed a tougher mix to your team.
Average Handle Time (AHT)
Average handle time is the active work time an agent spends per ticket, not counting time spent waiting. It's a capacity metric, not a satisfaction metric, and it doesn't mean much when measured on the AI side, since AI doesn't work the way a human agent does. Track it specifically for your human team to size headcount, rather than to compare against AI.
Customer Satisfaction (CSAT)
CSAT is the percentage of customers who rate an interaction positively on a post-resolution survey, usually on a 1-5 scale or a thumbs up/down. It's the most commonly tracked customer service KPI, and also the one most damaged by blending. A drop in blended CSAT could mean AI is giving confidently wrong answers, or it could mean your human team is overloaded, and rushing replies, and those are opposite root causes with opposite fixes.
First Contact Resolution (FCR)
FCR is the percentage of tickets resolved in a single interaction, with no follow-up required, calculated as the number of tickets resolved on first contact divided by the total number of tickets. An 85% blended FCR could hide a 95-to-55 AI-to-human split or a 90-to-80 split, and those describe very different support operations. Split FCR by resolver before drawing any conclusion from the number.
Customer Effort Score (CES)
CES asks customers to rate how easy an interaction felt, usually on a 1-7 or 1-10 scale, on the theory that low effort predicts loyalty better than satisfaction alone. AI-resolved CES reflects how easy the self-serve or bot interaction felt; human-resolved CES reflects agent-side friction like transfers and repeated questions. A blended CES tells you effort is a problem somewhere, not where.
Resolution SLA / SLA Compliance
SLA compliance is the percentage of tickets resolved within a committed time window, usually tiered by priority. AI resolution is close to instant by default, so AI-heavy teams often see blended SLA compliance climb even when the human side of the operation hasn't improved at all. Track SLA compliance for human-resolved tickets, specifically if the commitment is meant to reflect your team's actual responsiveness.
Quality Score (QA Audit)
Quality score comes from an internal audit: a sample of closed tickets scored against a rubric for tone, accuracy, and policy adherence. AI-resolved conversations can be scored on 100% of the volume, since the audit can run automatically, whereas human QA usually remains sample-based. Comparing a 100%-audited AI score against a 5%-sampled human score as if they're the same kind of number is a common reporting mistake.
Cost per Resolution
Cost per resolution is the total support cost divided by the number of tickets resolved over a period, intended to indicate whether support is becoming more or less expensive to run. AI-resolved and human-resolved costs can differ by 10 to 50 times, depending on complexity and the AI pricing model. A blended cost per resolution trending down could mean genuine efficiency gains, or it could mean volume mix shifted toward AI without either resolution type actually getting cheaper.
AI Autonomous Resolution Rate
The AI autonomous resolution rate is the percentage of AI-touched conversations resolved without ever escalating to a human. It's the headline number most CS leaders report to leadership when asked how automation is progressing. It has no pre-AI equivalent, because there was no AI-touched category of ticket to measure before AI resolution existed as a workflow.
Escalation Rate
Escalation rate is the inverse of autonomous resolution rate: the percentage of AI-touched conversations handed to a human. Where the resolution rate is the number leadership wants, the escalation rate is the number your automation team actually works from, since it points directly at what AI isn't confident enough to handle. A rising rate of escalation on stable ticket types usually signals a knowledge gap, not a model problem.
AI autonomous resolution rate and escalation rate are two sides of the same signal, and they're worth naming separately because different audiences ask for different framing. Leadership wants to hear "AI resolves 62% of volume." Your team planning the next automation build wants "38% still escalates, and here's why." Neither existed as a customer support KPI before AI resolution, because there was no AI-touched category to measure against.
Retention, churn, and a handful of other business-level KPIs don't split cleanly by AI versus human. They're still worth tracking, just not with the same lens.
Net Promoter Score (NPS)
NPS asks customers how likely they are to recommend the company, on a 0-10 scale, then nets the percentage of detractors (0-6) from promoters (9-10). It's a relationship-level metric, not tied to any single resolution, so it doesn't split meaningfully by AI versus human the way FCR or CSAT does. Track it as a lagging indicator of overall support quality, not a per-interaction score.
Customer Retention Rate
Customer retention rate is the percentage of customers still active at the end of a period compared to the start, excluding new customers acquired during that period. It's downstream of many touches over time, support included, so one bad AI interaction rarely shows up here directly. Still worth watching alongside support KPIs to catch whether support quality is contributing to churn.
Customer Churn Rate
Churn rate is the inverse of retention: the percentage of customers lost over a period. Same underlying signal, same caveats. Support teams rarely move this number on their own, but a spike is worth investigating alongside a drop in CSAT or FCR.
Customer Lifetime Value (CLV)
CLV estimates the total revenue expected from a customer over the life of the relationship, typically calculated using average purchase value, purchase frequency, and average customer lifespan. It's a business-level KPI that indirectly supports and influences retention and expansion. It shouldn't be something a support team is measured against directly.
Agent Satisfaction (eNPS)
Agent satisfaction, often measured as an employee's Net Promoter Score, asks your support team how likely they are to recommend working at your company. It's a purely human-team metric with no AI-side equivalent to split against. Worth tracking, especially as AI takes on more routine volume, since the agent role and workload shift in ways that directly affect this number.
Ticket Volume
Ticket volume is the total number of requests logged in a period, the most basic customer support KPI there is. It only counts what became a ticket, so it undercounts real demand once AI resolves requests before anything is ever logged. Still useful for capacity planning, paired with the self-service resolution rate to see the full picture.
Ticket Backlog
Ticket backlog is the number of open, unresolved tickets at a given point in time. It's a staffing and capacity signal rather than a resolution-quality one: a growing backlog usually means demand outpaced capacity, not that quality dropped. Watch it alongside AHT and FRT to catch capacity problems before they surface in customer-facing numbers.
Ticket Reopens
Ticket reopens track the percentage of resolved tickets a customer reopens, usually because the original resolution didn't hold. It's a strong proxy for resolution quality that FCR alone can miss, since a ticket can close on first contact and still be wrong. Worth tracking by channel, though you'll need a fairly large sample size before meaningfully splitting it between AI and human.
Volume by Channel
Volume by channel shows how requests are distributed across Slack, email, chat, and any other channels you support. It's more of a routing and capacity-planning input than a performance KPI on its own. Useful for deciding where to invest in AI coverage next: a channel carrying disproportionate volume with low AI involvement is usually the next automation target.
Tracking Customer Service KPIs Across Multiple Tools
The AI-versus-human split above assumes you can see both numbers in one place. On most B2B support stacks, you can't. If AI resolves requests in Slack, tickets escalate to Zendesk or Jira, and self-service happens in a separate help center tool, "resolution rate" means three different partial numbers depending on which system generated the report.
This isn't a hypothetical. It's the default state for a team running Salesforce or Zendesk with a bolted-on AI layer that only reads its own conversation logs, plus a separate knowledge base tool with its own analytics. Reconciling those three numbers into a single true figure is usually a manual export-and-join exercise, repeated every reporting cycle.
How Enjo Helps You Improve These Tracks Customer Service KPIs
Enjo doesn't just help you track these numbers; it changes them by automating the work behind them. AI Agents resolve routine requests in Slack, Teams, or a help center before a ticket ever needs a human, which drives first-contact resolution and self-service resolution rates. Agent Assist gives human agents real-time case summaries and reply suggestions, which help reduce average handle and resolution times for tickets that reach a person.
Sentiment analysis flags negative or escalated conversations early, protecting CSAT and CES before a bad interaction turns into a bad review. Insights surfaces the trends across ticket volume and sentiment, giving a CS leader a way to measure the impact of support automation instead of pulling a manual report every quarter.
Aptean is a useful illustration of scale. Across 80+ products and 3,500+ employees, Aptean uses Enjo AI Agents to accelerate 200,000+ customer service requests a year, work equivalent to roughly 120 additional agents, with 2M+ documents indexed as the knowledge base behind it. That's automation moving the underlying numbers, not a dashboard reporting on them after the fact.
How Many Customer Service KPIs to Track
Not every KPI above deserves a permanent home on your dashboard. Pick the ones tied to a decision you're actually making this quarter: hiring, automation investment, or an SLA renegotiation. Cap it at five or six. If a KPI hasn't changed a decision in two review cycles, retire it rather than let the dashboard grow past what anyone actually reads.
Customer Service KPIs: A Quick Recap
Track KPIs as two numbers, not one, whenever AI and a human might both touch the same type of request: split FCR, CSAT, resolution time, and cost per resolution by who actually resolved it. Keep NPS, retention, churn, and a handful of others as single numbers, since they don't split meaningfully by resolver. Doing this on a fragmented stack usually means reconciling exports by hand every reporting cycle. Either way, cap the dashboard at five or six KPIs tied to a real decision, not everything a helpdesk can export.
Frequently Asked Questions
What's the difference between a customer service KPI and a metric?
A metric is anything you can measure. A KPI is a metric tied to a specific goal you're accountable for, like reducing average resolution time by a set amount this quarter. Not every metric needs to be a KPI.
How many customer service KPIs should a team track?
Five to six on a standing dashboard is a reasonable ceiling for most B2B support teams. More than that dilutes focus without adding decision-making value.
Should first-contact resolution be reported as a single number, or split by AI vs. human?
Split it. A single blended FCR can look identical whether AI is doing most of the work or almost none, and those are different operational situations that require different fixes.
What's a KPI that didn't exist before AI resolution?
Escalation rate, the percentage of AI-touched conversations handed to a human, has no pre-AI equivalent and is one of the more useful numbers for deciding where to expand automation next.
How does AI resolution rate fit alongside traditional support KPIs?
It sits next to them, not in place of them. CSAT and resolution time still matter; AI resolution rate tells you how much of that performance is coming from AI versus your human team, which changes how you'd act on the number.

Transform complex support workflows


Stay Informed and Inspired


Start Free. Prove Value. Scale When Ready.
Use Enjo for real customer conversations and see how it fits your support workflow. Scale as your support grows.


