Top 12 Customer Service Metrics to Track in 2026 (+ Formulas)
Customer service metrics are the foundation of any support team looking to grow in 2026. According to PwC's Future of Customer Experience study, 73% of consumers point to experience as a key factor in their purchasing decisions, yet only 49% believe companies actually deliver a good one. That gap is exactly where the right metrics come in. Whether you're running an enterprise help desk or scaling SMB support, tracking the right metrics is what separates teams that reduce churn, build loyalty, and optimize operations from those that don't. As customer expectations rise, measuring customer experience (CX) has moved from optional to essential.
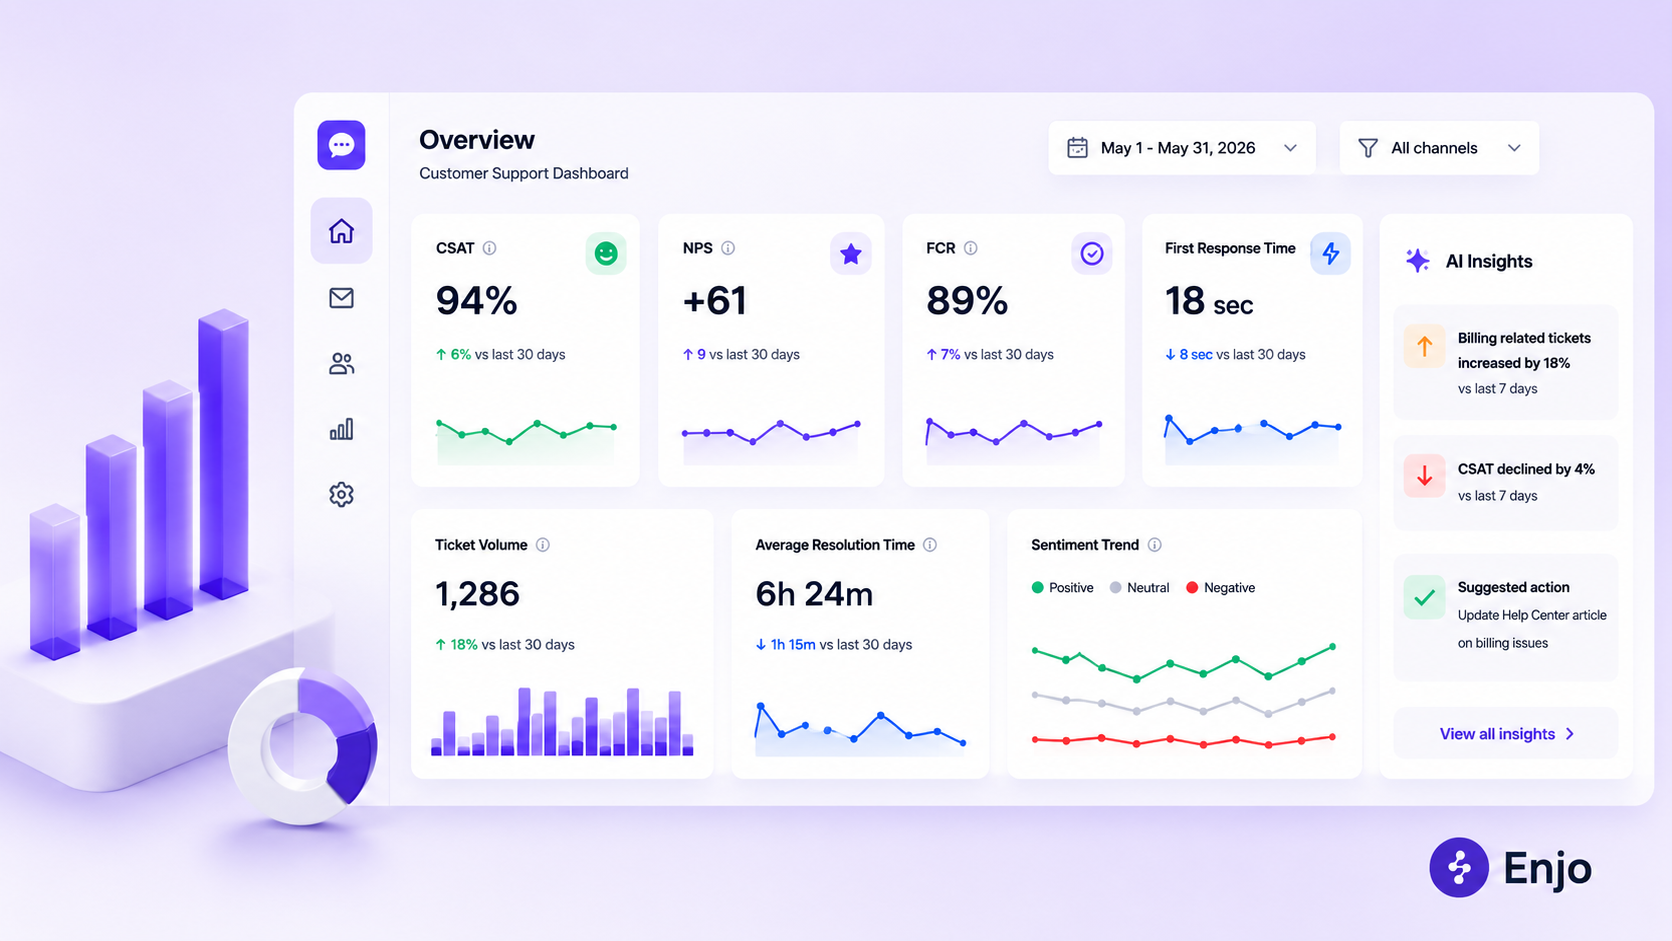
With AI-driven support platforms like Enjo, measuring these metrics is faster and more precise than ever. Enjo automates data collection, analyzes trends across channels, and surfaces actionable insights in real time, so support teams spend less time pulling reports and more time delighting customers.
In this guide, we'll walk through the top 12 customer service metrics to track, with clear definitions, formulas, and how AI sharpens the process. If you're ready to build a smarter, more data-driven support operation, these metrics are your starting point.
1. Customer Satisfaction Score (CSAT)
CSAT is the most direct way to measure how happy customers are with your service after an interaction. It captures immediate feedback to help you gauge the quality of support in real time.
What it measures:
CSAT gauges how satisfied customers are with a specific interaction or overall service experience.
How to measure it:
Typically, organizations send a short survey immediately after a support interaction. One common question is:
"How satisfied were you with your recent experience?"
Customers rate their satisfaction on a scale, most often 1 to 5 or 1 to 7, where the highest value indicates complete satisfaction.
To calculate CSAT, take the number of satisfied responses (usually ratings of 4 or 5) divided by the total responses, then multiply by 100 to get a percentage.
Example: If 80 out of 100 respondents rate the service as 4 or 5, your CSAT is 80%.
Why CSAT matters:
It provides direct feedback on customer perceptions of your service, allowing teams to quickly identify successes and areas needing improvement.
Best practices:
- Send CSAT surveys immediately after ticket closure or chat resolution.
- Keep surveys brief to improve response rates.
- Use AI automation to trigger and collect surveys consistently across channels.
- Monitor CSAT trends over time and segment by product, team, or channel.
In this case, Enjo automate CSAT survey deployment and aggregate results in real time. They can correlate CSAT scores with agent performance and case complexity, helping pinpoint issues behind low satisfaction.

2. Net Promoter Score (NPS)
NPS measures customer loyalty by asking how likely customers are to recommend your brand to others. It’s a leading indicator of overall satisfaction and business growth potential.
What it measures:
NPS gauges the likelihood that your customers will promote your product or service, reflecting long-term brand loyalty.
How to measure it:
Customers receive a single-question survey:
"On a scale of 0 to 10, how likely are you to recommend our company/product to a friend or colleague?"
Based on the rating, customers fall into three groups:
- Promoters (9-10): Loyal enthusiasts who will keep buying and refer others.
- Passives (7-8): Satisfied but unenthusiastic customers vulnerable to competitors.
- Detractors (0-6): Unhappy customers who can damage your brand through negative word-of-mouth.
Calculate NPS by subtracting the percentage of detractors from the percentage of promoters:
NPS = % Promoters − % Detractors
The resulting score ranges from -100 to +100.
Why NPS matters:
NPS captures the overall sentiment toward your brand beyond individual interactions. High NPS correlates strongly with revenue growth and customer retention.
Best practices:
- Collect NPS surveys periodically (quarterly or biannually) to track long-term trends.
- Pair NPS data with follow-up questions to understand the reasons behind scores.
- Segment NPS by customer demographics, product lines, or regions for deeper insights.
- Use AI tools to analyze open-ended feedback and identify areas for improvement.
With Enjo, you can automate NPS survey distribution and analyze results in context with support interactions. AI can detect patterns and predict customers at risk of becoming detractors, enabling proactive engagement.
3. Customer Effort Score (CES)
CES measures how much effort customers must exert to get their issues resolved. Lower effort leads to higher satisfaction and loyalty.
What it measures:
CES assesses the ease or difficulty of the customer support experience, with a focus on reducing friction.
How to measure it:
After a support interaction, ask customers a question like:
"How easy was it to get your issue resolved today?"
Responses typically use a scale ranging from “Very difficult” to “Very easy” or a numerical scale like 1 to 5.
To calculate CES, either average the scores or track the percentage of customers who rate their experience as ‘easy’.
Why CES matters:
Reducing customer effort minimizes frustration and increases the likelihood of repeat business. It predicts churn better than satisfaction alone because customers will abandon a brand if it’s too hard to get help.
Best practices:
- Deploy CES surveys immediately after issue resolution for timely feedback.
- Use specific, focused questions around effort rather than satisfaction.
- Combine CES data with other metrics, such as FCR, to get a full CX picture.
- Leverage AI to analyze CES trends and flag cases with high customer effort.
4. First Contact Resolution (FCR)
FCR measures the percentage of customer issues resolved in the first interaction without follow-up. It is a key driver of customer satisfaction and operational efficiency.
What it measures:
FCR indicates how effectively your support team addresses customer problems promptly and completely in the initial contact.
How to measure it:
Calculate FCR by dividing the number of cases resolved on the first interaction by the total number of support cases, then multiplying by 100 to express it as a percentage.
Data for FCR can be gathered from your ticketing system, support calls, or chat transcripts.
Why FCR matters:
High FCR improves customer satisfaction by eliminating the frustration of repeated contacts. It also reduces support costs and agent workload.
Best practices:
- Define clear criteria for what constitutes “resolution” in your context.
- Collect consistent data across support channels.
- Use AI to analyze interactions for unresolved issues and automate simple fixes.
- Monitor FCR trends over time and across teams for continuous improvement.
How AI platforms help:
AI Agents like Enjo’s can resolve routine queries instantly, boosting FCR rates. Additionally, AI-driven Agent Assist tools provide agents with real-time suggestions to resolve complex cases faster on the first contact.
5. Average Handle Time (AHT) and Average Resolution Time (ART)
AHT and ART measure how long it takes to handle and resolve customer issues, respectively. These metrics help balance efficiency with service quality.
What they measure:
- Average Handle Time (AHT): The time spent actively managing a customer interaction, including talk time, hold time, and after-call work.
- Average Resolution Time (ART): The total elapsed time from when a customer issue is reported until it is fully resolved.
How to measure them:
- AHT: Sum total handle time for all interactions divided by the number of handled cases.
- ART: Calculate the average time difference between ticket creation and closure across all resolved tickets.
Why they matter:
Shorter AHT and ART generally indicate efficient support. However, too much emphasis on speed can degrade quality. Balancing these metrics ensures customers get timely and thorough solutions.
Best practices:
- Monitor both AHT and ART in tandem to avoid sacrificing quality for speed.
- Segment by issue type and support channel for granular insights.
- Use AI to assist agents with suggested responses, automate routine tasks, and prioritize cases, reducing handling and resolution times.
Enjo can reduce handling and resolution times by automating repetitive steps and providing agents with contextual knowledge and actions in real time. Agent Assist can also generate insights to identify bottlenecks in processes causing delays.
AHT and ART are two of the most commonly cited customer service performance metrics for operational efficiency.
Learn how to measure the real impact of support automation.
6. Customer Retention and Churn Rates
Customer retention and churn rates measure how well your business keeps its customers over time. Retention signals satisfaction and loyalty, while churn highlights the rate at which customers leave.
What they measure:
- Retention Rate: The percentage of customers who continue doing business with you over a specific period.
- Churn Rate: The percentage of customers lost during that same period.
How to measure them:
- Track customer cohorts over time by comparing the number of customers at the start and end of a defined period.
- Calculate retention as:
(Customers at end of period / Customers at start of period) × 100 - Calculate churn as:
100 – Retention Rate
Why they matter:
Retention is a critical indicator of long-term customer satisfaction and business health. High churn often signals problems in product quality, support, or overall customer experience.
Best practices:
- Segment retention and churn by customer type, product line, or region to discover specific challenges.
- Combine churn data with customer feedback for root cause analysis.
- Implement proactive retention strategies informed by data insights.
AI-driven analytics can predict customers at high risk of churn by analyzing support interactions, sentiment, and resolution history. Enjo’s AI Agents enable timely engagement with at-risk customers, improving retention through personalized support.
Retention and churn sit alongside core customer care metrics such as CSAT and NPS to link support quality to business outcomes.
Understand how AI support agents automate repetitive support tasks.
7. Ticket Volume and Trend Analysis
Ticket volume tracking helps organizations understand support demand and identify underlying issues by analyzing the number and types of incoming requests over time.
What it measures:
The total number of support tickets opened within a specific period, segmented by channel, issue type, or product area.
How to measure it:
- Use your ai ticketing or helpdesk system to track daily, weekly, and monthly ticket counts.
- Break down data by categories such as issue type, channel (email, chat, phone), or customer segment.
- Monitor volume spikes or drops to detect anomalies.
Why it matters:
Rising ticket volumes can signal product defects, service outages, or changes in customer behavior. Conversely, declining volumes might indicate successful self-service or improved product stability. Understanding trends enables proactive resource planning and process improvements.
Best practices:
- Set up automated dashboards to visualize ticket trends in real time.
- Correlate ticket spikes with product releases or campaigns to find cause-and-effect relationships.
- Regularly review ticket categories and update the taxonomy to ensure accurate trend analysis.
Enjo provides intelligent ticket categorization, trend detection, and root cause identification at scale. Enjo AI Insights highlights emerging issues quickly, enabling faster response and reducing support overload.
Ticket volume is one of the more operational customer service metrics on this list, more useful for capacity planning than for judging service quality on its own.

8. Customer Sentiment Analysis
Sentiment analysis uses AI to evaluate the emotional tone behind customer communications, revealing their true feelings about your service.
What it measures:
The positivity, neutrality, or negativity expressed in customer messages, tickets, reviews, and chats.
How to measure it:
- Deploy AI-powered Natural Language Processing (NLP) tools to analyze text data from support interactions.
- Classify messages into sentiment categories such as positive, neutral, or negative.
- Track sentiment trends over time or by agent, product, or issue.
Why it matters:
Sentiment provides qualitative insight beyond simple satisfaction scores. It helps identify underlying frustration or enthusiasm, enabling support teams to tailor responses effectively.
Best practices:
- Combine sentiment data with quantitative CX metrics for a holistic view.
- Monitor sentiment shifts after product updates or policy changes.
- Use sentiment flags to prioritize urgent cases or escalate negative experiences promptly.
Enjo automatically analyze sentiment in real time, alerting agents to negative or escalated cases early. This allows support teams to intervene before dissatisfaction worsens and to refine training materials based on emotional feedback patterns.
9. Self-Service Adoption Rate
The self-service adoption rate measures how often customers resolve their issues through automated channels without contacting support agents.
What it measures:
The percentage of support requests handled via knowledge bases, FAQs, chatbots, or AI Agents.
How to measure it:
- Track usage statistics such as page views, search queries, and chatbot interactions.
- Calculate the percentage of total support issues resolved without agent involvement.
- Analyze bounce rates and repeat usage for effectiveness.
Why it matters:
A high self-service adoption rate reduces support costs and empowers customers to get quick answers. It frees agents to focus on complex cases, improving overall CX.
Best practices:
- Regularly update and optimize knowledge base content to reflect common issues.
- Use AI to personalize self-service suggestions based on user behavior.
- Promote self-service options clearly across customer touchpoints.
Enjo enable intelligent AI chatbots and automated knowledge retrieval that dynamically guide users to solutions. AI continuously learns from ticket data to improve self-service accuracy and reduce escalations.
This is a staple on any customer service metrics dashboard, since deflected volume is often larger than the sum of all ticket-based metrics.
Find the best customer self-service portal for your business.
10. Support Agent Performance Metrics
Tracking individual agent metrics helps maintain high-quality customer support and identifies opportunities for coaching and improvement.
What it measures:
- Agent-specific CSAT scores
- Resolution and first contact rates
- Average handle and resolution times
- Ticket backlog and workload balance
How to measure it:
- Leverage your ticketing system and support platform dashboards to extract agent-level data.
- Combine quantitative metrics with qualitative feedback from customers and supervisors.
Why it matters:
Measuring agent performance ensures accountability, identifies training needs, and helps distribute workload effectively. High-performing agents improve customer satisfaction and operational efficiency.
Best practices:
- Set realistic performance benchmarks and goals.
- Use data to design targeted coaching programs.
- Recognize and reward top performers regularly.
Enjo’s Agent Assist provide agents with real-time recommendations and automate routine tasks, improving productivity and consistency. AI insights highlight performance gaps and success factors to guide management.
Learn how today's support leaders build high-performing customer service teams.
11. First Response Time (FRT)
First Response Time is often confused with Average Handle Time, but the two measure different things. FRT tracks how long a customer waits for the first reply after opening a request; AHT and ART track the work of actually resolving it.
What it measures:
The time from ticket creation to the first reply, not the full resolution, just the first touch.
How to measure it:
Sum first-reply time across all tickets, divide by ticket count. Segment by channel (Slack, email, chat), since response speed varies a lot by channel.
Why it matters:
AI-resolved FRT sits close to instant, since the agent replies as soon as it reads the request; human-resolved FRT reflects real staffing and triage. Reporting a single blended number can make a well-staffed, AI-heavy team look identical to an understaffed one that got lucky with volume mix.
Best practices:
- Track FRT separately for AI-resolved and human-resolved conversations, rather than a single blended average.
- Segment by channel to catch slow queues before they show up in customer complaints.
- Pair FRT with Average Resolution Time; a fast first reply that goes nowhere doesn't help the customer.
Enjo's AI Agents reply in Slack, Teams, or email as soon as a request comes in, so FRT on AI-touched volume is near-instant by default. Agent Assist provides human agents with case summaries and reply suggestions in the moment, helping human-side FRT stay on track as ticket volume grows.
12. Ticket Reopens
A ticket can close on first contact and still be wrong. Reopen rate is what catches that when FCR alone won't.
What it measures:
The percentage of resolved tickets a customer reopens because the original fix didn't hold.
How to measure it:
(Reopened tickets ÷ total resolved tickets) × 100. Needs a reasonably large sample size before meaningfully splitting by AI vs. human resolver.
Why it matters:
A high First Contact Resolution rate can hide a quality problem if a meaningful share of those “resolved” tickets come back. Reopens are a more honest signal of whether the fix actually held.
Best practices:
- Track reopens by channel; patterns often cluster around specific request types or queues.
- Read reopens alongside FCR, not instead of it, together they show whether tickets are closing fast and staying closed.
- Use AI to flag tickets likely to reopen before closure, based on patterns from past reopenings.
Enjo's Insights surfaces reopen trends by category and channel, so a rising reopen rate specific request type is flagged before it becomes a broader satisfaction problem.
Conclusion
Measuring the right customer experience metrics is vital for delivering exceptional support and driving business growth. Whether you track these as a customer service scorecard, a KPI dashboard, or a running list, the metrics themselves don't change; only how you act on them does. From satisfaction and loyalty scores to operational KPIs such as first-contact resolution and self-service adoption, each metric reveals a crucial aspect of your customers' journey.
If you're building the business case for automation, our breakdown of the ROI of AI service desks walks through the cost math finance teams actually ask for.
Leveraging AI-powered customer and employee support platforms like Enjo transforms measurement from a manual chore into an automated, data-driven process. AI accelerates insight generation, enhances agent effectiveness, and enables proactive customer engagement at scale.

Frequently Asked Questions
What are the most important customer service metrics to track?
The most important customer service metrics are Customer Satisfaction Score (CSAT), Net Promoter Score (NPS), Customer Effort Score (CES), First Contact Resolution (FCR), and Average Resolution Time (ART). Together, these five cover customer sentiment, loyalty, ease of experience, and operational efficiency — giving support teams a complete picture of service quality and business impact.
What is a good CSAT score?
A good CSAT score is typically 75–85%, while top-performing support teams score 90% or higher. Benchmarks vary by industry; SaaS and B2B tech average around 80%, while retail and hospitality often see 85% or higher. Consistently tracking CSAT by channel, agent, and issue type matters more than chasing a single number.
What is a good Net Promoter Score (NPS) for customer service?
Any NPS above 0 is positive, above 30 is good, above 50 is excellent, and above 70 is world-class. B2B SaaS companies typically average 30–40, while top consumer brands target 50+. Focus on the trend direction rather than a single number; a steadily rising NPS signals improving loyalty over time.
What's the difference between CSAT, NPS, and CES?
CSAT measures satisfaction with a specific interaction (transactional), NPS measures overall loyalty and likelihood to recommend your brand (relational), and CES measures how much effort a customer had to put in to resolve an issue (experiential). Using all three together gives support teams the most complete view of customer health.
What are customer service KPIs?
Customer service KPIs are measurable targets that show how effectively a support team serves customers. The top KPIs include CSAT, NPS, CES, First Contact Resolution, Average Resolution Time, ticket volume trends, self-service adoption rate, and agent performance metrics. Together they measure both customer sentiment and operational efficiency.
1. Customer Satisfaction Score (CSAT)
CSAT is the most direct way to measure how happy customers are with your service after an interaction. It captures immediate feedback to help you gauge the quality of support in real time.
What it measures:
CSAT gauges how satisfied customers are with a specific interaction or overall service experience.
How to measure it:
Typically, organizations send a short survey immediately after a support interaction. One common question is:
"How satisfied were you with your recent experience?"
Customers rate their satisfaction on a scale, most often 1 to 5 or 1 to 7, where the highest value indicates complete satisfaction.
To calculate CSAT, take the number of satisfied responses (usually ratings of 4 or 5) divided by the total responses, then multiply by 100 to get a percentage.
Example: If 80 out of 100 respondents rate the service as 4 or 5, your CSAT is 80%.
Why CSAT matters:
It provides direct feedback on customer perceptions of your service, allowing teams to quickly identify successes and areas needing improvement.
Best practices:
- Send CSAT surveys immediately after ticket closure or chat resolution.
- Keep surveys brief to improve response rates.
- Use AI automation to trigger and collect surveys consistently across channels.
- Monitor CSAT trends over time and segment by product, team, or channel.
In this case, Enjo automate CSAT survey deployment and aggregate results in real time. They can correlate CSAT scores with agent performance and case complexity, helping pinpoint issues behind low satisfaction.
2. Net Promoter Score (NPS)
NPS measures customer loyalty by asking how likely customers are to recommend your brand to others. It’s a leading indicator of overall satisfaction and business growth potential.
What it measures:
NPS gauges the likelihood that your customers will promote your product or service, reflecting long-term brand loyalty.
How to measure it:
Customers receive a single-question survey:
"On a scale of 0 to 10, how likely are you to recommend our company/product to a friend or colleague?"
Based on the rating, customers fall into three groups:
- Promoters (9-10): Loyal enthusiasts who will keep buying and refer others.
- Passives (7-8): Satisfied but unenthusiastic customers vulnerable to competitors.
- Detractors (0-6): Unhappy customers who can damage your brand through negative word-of-mouth.
Calculate NPS by subtracting the percentage of detractors from the percentage of promoters:
NPS = % Promoters − % Detractors
The resulting score ranges from -100 to +100.
Why NPS matters:
NPS captures the overall sentiment toward your brand beyond individual interactions. High NPS correlates strongly with revenue growth and customer retention.
Best practices:
- Collect NPS surveys periodically (quarterly or biannually) to track long-term trends.
- Pair NPS data with follow-up questions to understand the reasons behind scores.
- Segment NPS by customer demographics, product lines, or regions for deeper insights.
- Use AI tools to analyze open-ended feedback and identify areas for improvement.
With Enjo, you can automate NPS survey distribution and analyze results in context with support interactions. AI can detect patterns and predict customers at risk of becoming detractors, enabling proactive engagement.
3. Customer Effort Score (CES)
CES measures how much effort customers must exert to get their issues resolved. Lower effort leads to higher satisfaction and loyalty.
What it measures:
CES assesses the ease or difficulty of the customer support experience, with a focus on reducing friction.
How to measure it:
After a support interaction, ask customers a question like:
"How easy was it to get your issue resolved today?"
Responses typically use a scale ranging from “Very difficult” to “Very easy” or a numerical scale like 1 to 5.
To calculate CES, either average the scores or track the percentage of customers who rate their experience as ‘easy’.
Why CES matters:
Reducing customer effort minimizes frustration and increases the likelihood of repeat business. It predicts churn better than satisfaction alone because customers will abandon a brand if it’s too hard to get help.
Best practices:
- Deploy CES surveys immediately after issue resolution for timely feedback.
- Use specific, focused questions around effort rather than satisfaction.
- Combine CES data with other metrics, such as FCR, to get a full CX picture.
- Leverage AI to analyze CES trends and flag cases with high customer effort.
4. First Contact Resolution (FCR)
FCR measures the percentage of customer issues resolved in the first interaction without follow-up. It is a key driver of customer satisfaction and operational efficiency.
What it measures:
FCR indicates how effectively your support team addresses customer problems promptly and completely in the initial contact.
How to measure it:
Calculate FCR by dividing the number of cases resolved on the first interaction by the total number of support cases, then multiplying by 100 to express it as a percentage.
Data for FCR can be gathered from your ticketing system, support calls, or chat transcripts.
Why FCR matters:
High FCR improves customer satisfaction by eliminating the frustration of repeated contacts. It also reduces support costs and agent workload.
Best practices:
- Define clear criteria for what constitutes “resolution” in your context.
- Collect consistent data across support channels.
- Use AI to analyze interactions for unresolved issues and automate simple fixes.
- Monitor FCR trends over time and across teams for continuous improvement.
How AI platforms help:
AI Agents like Enjo’s can resolve routine queries instantly, boosting FCR rates. Additionally, AI-driven Agent Assist tools provide agents with real-time suggestions to resolve complex cases faster on the first contact.
5. Average Handle Time (AHT) and Average Resolution Time (ART)
AHT and ART measure how long it takes to handle and resolve customer issues, respectively. These metrics help balance efficiency with service quality.
What they measure:
- Average Handle Time (AHT): The time spent actively managing a customer interaction, including talk time, hold time, and after-call work.
- Average Resolution Time (ART): The total elapsed time from when a customer issue is reported until it is fully resolved.
How to measure them:
- AHT: Sum total handle time for all interactions divided by the number of handled cases.
- ART: Calculate the average time difference between ticket creation and closure across all resolved tickets.
Why they matter:
Shorter AHT and ART generally indicate efficient support. However, too much emphasis on speed can degrade quality. Balancing these metrics ensures customers get timely and thorough solutions.
Best practices:
- Monitor both AHT and ART in tandem to avoid sacrificing quality for speed.
- Segment by issue type and support channel for granular insights.
- Use AI to assist agents with suggested responses, automate routine tasks, and prioritize cases, reducing handling and resolution times.
Enjo can reduce handling and resolution times by automating repetitive steps and providing agents with contextual knowledge and actions in real time. Agent Assist can also generate insights to identify bottlenecks in processes causing delays.
AHT and ART are two of the most commonly cited customer service performance metrics for operational efficiency.
Learn how to measure the real impact of support automation.
6. Customer Retention and Churn Rates
Customer retention and churn rates measure how well your business keeps its customers over time. Retention signals satisfaction and loyalty, while churn highlights the rate at which customers leave.
What they measure:
- Retention Rate: The percentage of customers who continue doing business with you over a specific period.
- Churn Rate: The percentage of customers lost during that same period.
How to measure them:
- Track customer cohorts over time by comparing the number of customers at the start and end of a defined period.
- Calculate retention as:
(Customers at end of period / Customers at start of period) × 100 - Calculate churn as:
100 – Retention Rate
Why they matter:
Retention is a critical indicator of long-term customer satisfaction and business health. High churn often signals problems in product quality, support, or overall customer experience.
Best practices:
- Segment retention and churn by customer type, product line, or region to discover specific challenges.
- Combine churn data with customer feedback for root cause analysis.
- Implement proactive retention strategies informed by data insights.
AI-driven analytics can predict customers at high risk of churn by analyzing support interactions, sentiment, and resolution history. Enjo’s AI Agents enable timely engagement with at-risk customers, improving retention through personalized support.
Retention and churn sit alongside core customer care metrics such as CSAT and NPS to link support quality to business outcomes.
Understand how AI support agents automate repetitive support tasks.
7. Ticket Volume and Trend Analysis
Ticket volume tracking helps organizations understand support demand and identify underlying issues by analyzing the number and types of incoming requests over time.
What it measures:
The total number of support tickets opened within a specific period, segmented by channel, issue type, or product area.
How to measure it:
- Use your ai ticketing or helpdesk system to track daily, weekly, and monthly ticket counts.
- Break down data by categories such as issue type, channel (email, chat, phone), or customer segment.
- Monitor volume spikes or drops to detect anomalies.
Why it matters:
Rising ticket volumes can signal product defects, service outages, or changes in customer behavior. Conversely, declining volumes might indicate successful self-service or improved product stability. Understanding trends enables proactive resource planning and process improvements.
Best practices:
- Set up automated dashboards to visualize ticket trends in real time.
- Correlate ticket spikes with product releases or campaigns to find cause-and-effect relationships.
- Regularly review ticket categories and update the taxonomy to ensure accurate trend analysis.
Enjo provides intelligent ticket categorization, trend detection, and root cause identification at scale. Enjo AI Insights highlights emerging issues quickly, enabling faster response and reducing support overload.
Ticket volume is one of the more operational customer service metrics on this list, more useful for capacity planning than for judging service quality on its own.
8. Customer Sentiment Analysis
Sentiment analysis uses AI to evaluate the emotional tone behind customer communications, revealing their true feelings about your service.
What it measures:
The positivity, neutrality, or negativity expressed in customer messages, tickets, reviews, and chats.
How to measure it:
- Deploy AI-powered Natural Language Processing (NLP) tools to analyze text data from support interactions.
- Classify messages into sentiment categories such as positive, neutral, or negative.
- Track sentiment trends over time or by agent, product, or issue.
Why it matters:
Sentiment provides qualitative insight beyond simple satisfaction scores. It helps identify underlying frustration or enthusiasm, enabling support teams to tailor responses effectively.
Best practices:
- Combine sentiment data with quantitative CX metrics for a holistic view.
- Monitor sentiment shifts after product updates or policy changes.
- Use sentiment flags to prioritize urgent cases or escalate negative experiences promptly.
Enjo automatically analyze sentiment in real time, alerting agents to negative or escalated cases early. This allows support teams to intervene before dissatisfaction worsens and to refine training materials based on emotional feedback patterns.
9. Self-Service Adoption Rate
The self-service adoption rate measures how often customers resolve their issues through automated channels without contacting support agents.
What it measures:
The percentage of support requests handled via knowledge bases, FAQs, chatbots, or AI Agents.
How to measure it:
- Track usage statistics such as page views, search queries, and chatbot interactions.
- Calculate the percentage of total support issues resolved without agent involvement.
- Analyze bounce rates and repeat usage for effectiveness.
Why it matters:
A high self-service adoption rate reduces support costs and empowers customers to get quick answers. It frees agents to focus on complex cases, improving overall CX.
Best practices:
- Regularly update and optimize knowledge base content to reflect common issues.
- Use AI to personalize self-service suggestions based on user behavior.
- Promote self-service options clearly across customer touchpoints.
Enjo enable intelligent AI chatbots and automated knowledge retrieval that dynamically guide users to solutions. AI continuously learns from ticket data to improve self-service accuracy and reduce escalations.
This is a staple on any customer service metrics dashboard, since deflected volume is often larger than the sum of all ticket-based metrics.
Find the best customer self-service portal for your business.
10. Support Agent Performance Metrics
Tracking individual agent metrics helps maintain high-quality customer support and identifies opportunities for coaching and improvement.
What it measures:
- Agent-specific CSAT scores
- Resolution and first contact rates
- Average handle and resolution times
- Ticket backlog and workload balance
How to measure it:
- Leverage your ticketing system and support platform dashboards to extract agent-level data.
- Combine quantitative metrics with qualitative feedback from customers and supervisors.
Why it matters:
Measuring agent performance ensures accountability, identifies training needs, and helps distribute workload effectively. High-performing agents improve customer satisfaction and operational efficiency.
Best practices:
- Set realistic performance benchmarks and goals.
- Use data to design targeted coaching programs.
- Recognize and reward top performers regularly.
Enjo’s Agent Assist provide agents with real-time recommendations and automate routine tasks, improving productivity and consistency. AI insights highlight performance gaps and success factors to guide management.
Learn how today's support leaders build high-performing customer service teams.
11. First Response Time (FRT)
First Response Time is often confused with Average Handle Time, but the two measure different things. FRT tracks how long a customer waits for the first reply after opening a request; AHT and ART track the work of actually resolving it.
What it measures:
The time from ticket creation to the first reply, not the full resolution, just the first touch.
How to measure it:
Sum first-reply time across all tickets, divide by ticket count. Segment by channel (Slack, email, chat), since response speed varies a lot by channel.
Why it matters:
AI-resolved FRT sits close to instant, since the agent replies as soon as it reads the request; human-resolved FRT reflects real staffing and triage. Reporting a single blended number can make a well-staffed, AI-heavy team look identical to an understaffed one that got lucky with volume mix.
Best practices:
- Track FRT separately for AI-resolved and human-resolved conversations, rather than a single blended average.
- Segment by channel to catch slow queues before they show up in customer complaints.
- Pair FRT with Average Resolution Time; a fast first reply that goes nowhere doesn't help the customer.
Enjo's AI Agents reply in Slack, Teams, or email as soon as a request comes in, so FRT on AI-touched volume is near-instant by default. Agent Assist provides human agents with case summaries and reply suggestions in the moment, helping human-side FRT stay on track as ticket volume grows.
12. Ticket Reopens
A ticket can close on first contact and still be wrong. Reopen rate is what catches that when FCR alone won't.
What it measures:
The percentage of resolved tickets a customer reopens because the original fix didn't hold.
How to measure it:
(Reopened tickets ÷ total resolved tickets) × 100. Needs a reasonably large sample size before meaningfully splitting by AI vs. human resolver.
Why it matters:
A high First Contact Resolution rate can hide a quality problem if a meaningful share of those “resolved” tickets come back. Reopens are a more honest signal of whether the fix actually held.
Best practices:
- Track reopens by channel; patterns often cluster around specific request types or queues.
- Read reopens alongside FCR, not instead of it, together they show whether tickets are closing fast and staying closed.
- Use AI to flag tickets likely to reopen before closure, based on patterns from past reopenings.
Enjo's Insights surfaces reopen trends by category and channel, so a rising reopen rate specific request type is flagged before it becomes a broader satisfaction problem.
Conclusion
Measuring the right customer experience metrics is vital for delivering exceptional support and driving business growth. Whether you track these as a customer service scorecard, a KPI dashboard, or a running list, the metrics themselves don't change; only how you act on them does. From satisfaction and loyalty scores to operational KPIs such as first-contact resolution and self-service adoption, each metric reveals a crucial aspect of your customers' journey.
If you're building the business case for automation, our breakdown of the ROI of AI service desks walks through the cost math finance teams actually ask for.
Leveraging AI-powered customer and employee support platforms like Enjo transforms measurement from a manual chore into an automated, data-driven process. AI accelerates insight generation, enhances agent effectiveness, and enables proactive customer engagement at scale.
Frequently Asked Questions
What are the most important customer service metrics to track?
The most important customer service metrics are Customer Satisfaction Score (CSAT), Net Promoter Score (NPS), Customer Effort Score (CES), First Contact Resolution (FCR), and Average Resolution Time (ART). Together, these five cover customer sentiment, loyalty, ease of experience, and operational efficiency — giving support teams a complete picture of service quality and business impact.
What is a good CSAT score?
A good CSAT score is typically 75–85%, while top-performing support teams score 90% or higher. Benchmarks vary by industry; SaaS and B2B tech average around 80%, while retail and hospitality often see 85% or higher. Consistently tracking CSAT by channel, agent, and issue type matters more than chasing a single number.
What is a good Net Promoter Score (NPS) for customer service?
Any NPS above 0 is positive, above 30 is good, above 50 is excellent, and above 70 is world-class. B2B SaaS companies typically average 30–40, while top consumer brands target 50+. Focus on the trend direction rather than a single number; a steadily rising NPS signals improving loyalty over time.
What's the difference between CSAT, NPS, and CES?
CSAT measures satisfaction with a specific interaction (transactional), NPS measures overall loyalty and likelihood to recommend your brand (relational), and CES measures how much effort a customer had to put in to resolve an issue (experiential). Using all three together gives support teams the most complete view of customer health.
What are customer service KPIs?
Customer service KPIs are measurable targets that show how effectively a support team serves customers. The top KPIs include CSAT, NPS, CES, First Contact Resolution, Average Resolution Time, ticket volume trends, self-service adoption rate, and agent performance metrics. Together they measure both customer sentiment and operational efficiency.

Transform complex support workflows


Stay Informed and Inspired


Start Free. Prove Value. Scale When Ready.
Use Enjo for real customer conversations and see how it fits your support workflow. Scale as your support grows.


